
grain size distribution
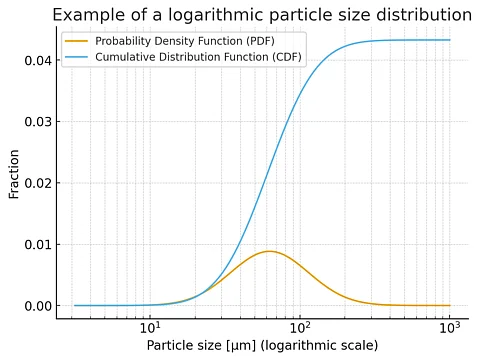
Two display modes: distribution function or sum function.
Bulk solids are complex systems. Even if they consist of only one component, they are difficult to describe unambiguously. A key characteristic is the particle size distribution. It indicates how the particle sizes are distributed within a material. This provides important information. For example, it can provide information about flowability, packing density, compactability and processability.
The particle size distribution can be represented in different ways. It is often specified as a distribution function that shows the proportion of a specific grain size. Alternatively, the sum function can also be used. This describes the total amount of particles that are smaller or larger than a specific grain size. This integral representation provides a quick overview.
In order to clearly represent large size ranges, the data is often plotted in logarithmic graphs. This allows fine and coarse particles to be displayed together without losing small differences. Other forms of representation have become established for special applications. A classic example is the Rosin-Rammler diagram. It is used to describe the particle size distribution of crushed solids using a simple mathematical function.
The choice of representation depends on the respective process. For process engineers, the particle size distribution forms the basis for assessing miscibility, agglomeration behaviour and product specifications. It is therefore a key parameter for characterising bulk solids in practice and designing refinement processes in a targeted manner.
The particle size distribution can be determined in various ways. This is traditionally done by sieving. The material is separated using sieves with defined mesh sizes and then weighed. This method is robust, but has its limitations when it comes to fine powders. Modern optical methods use laser light or image analysis. They measure particle sizes quickly and accurately, even in the micrometre range. Other methods use sedimentation or light scattering. In practice, several methods are often combined to reliably cover both coarse and fine ranges.